Analyzing Clinical Significance: The Percentage-Change Approach
2025-11-27
Source:vignettes/percentage-change-approach.Rmd
percentage-change-approach.RmdIntroduction
The percentage-change approach defines clinical significance based on the relative change in a patient’s score from baseline. This method is common in clinical trials where a specific reduction in symptoms, such as “a 50% improvement,” is a primary endpoint for defining treatment response.
A change is considered clinically significant if it meets or exceeds a predefined Percentage-Change Cutoff (PCC). For example, if the PCC is 50% (or 0.5), any patient who shows at least a 50% reduction in symptoms would be classified as “Improved”.
A key consideration for this method is that it is highly dependent on the patient’s baseline score. A 10-point drop is a 50% improvement for a patient starting at 20 points, but only a 25% improvement for a patient starting at 40 points. This characteristic should be kept in mind when interpreting the results.
This vignette demonstrates how to use the
cs_percentage() function to apply this approach.
Basic Analysis
Let’s analyze the claus_2020 dataset. A common benchmark
for depression treatment trials is a 50% reduction in symptom scores. We
will set this as our pct_improvement cutoff.
# Analyze change using a 50% improvement cutoff
pct_results <- claus_2020 |>
  cs_percentage(
    id = id,
    time = time,
    outcome = bdi,
    pre = 1,
    post = 4,
    pct_improvement = 0.5
  )

summary(pct_results)
#>
#> ---- Clinical Significance Results ----
#>
#> Approach:                 Percentage-based
#> Percentage Improvement:   50.00%
#> Percentage Deterioration: 50.00%
#> Better is:                Lower
#> N (original):             43
#> N (used):                 40
#> Percent used:             93.02%
#> Outcome:                  bdi
#>
#> Category     |  N | Percent
#> ---------------------------
#> Improved     | 11 |  27.50%
#> Unchanged    | 29 |  72.50%
#> Deteriorated |  0 |   0.00%
The summary shows that based on this 50% criterion, about 28% of patients are classified as having improved.
Visualizing the Results
The plot for the percentage-change approach looks similar to those for the anchor- and distribution-based methods. However, the shaded area is now determined by the percentage-change cutoff relative to each individual’s starting score. This means the boundaries of the “unchanged” area are not parallel lines.
plot(pct_results)
#> Ignoring unknown labels:
#> • colour : "Group"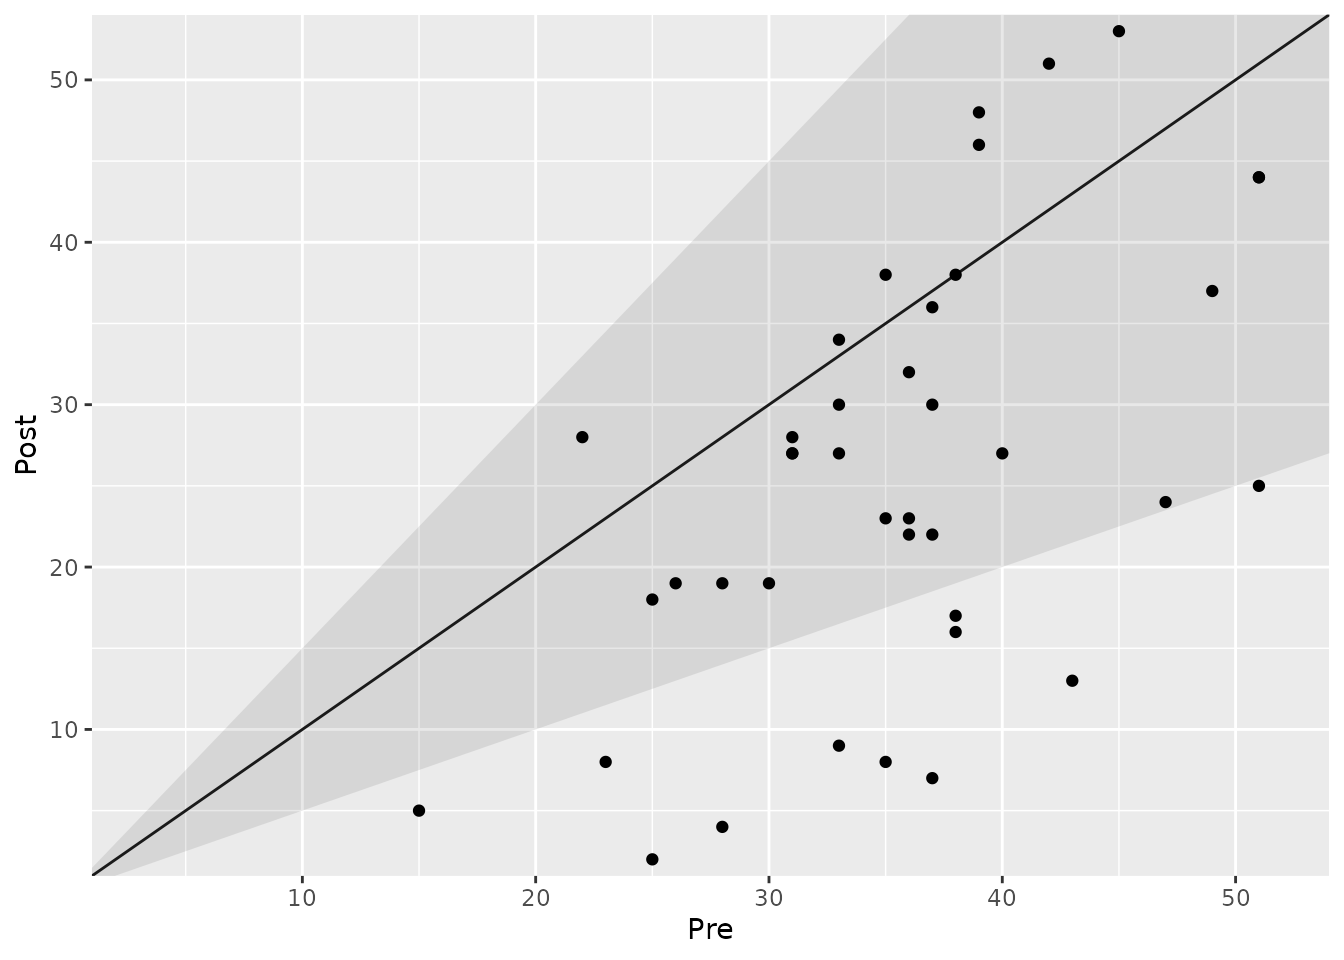
Grouped Analysis
We can also explore if the proportion of “responders” differs between the treatment groups (TAU vs. PA).
# Grouped analysis with a 50% improvement cutoff
pct_grouped <- claus_2020 |>
  cs_percentage(
    id = id,
    time = time,
    outcome = bdi,
    pre = 1,
    post = 4,
    pct_improvement = 0.5,
    group = treatment
  )

summary(pct_grouped)
#>
#> ---- Clinical Significance Results ----
#>
#> Approach:                 Percentage-based
#> Percentage Improvement:   50.00%
#> Percentage Deterioration: 50.00%
#> Better is:                Lower
#> N (original):             43
#> N (used):                 40
#> Percent used:             93.02%
#> Outcome:                  bdi
#>
#> Group |     Category |  N | Percent | Percent by Group
#> ------------------------------------------------------
#> TAU   |     Improved |  2 |   5.00% |           10.53%
#> TAU   |    Unchanged | 17 |  42.50% |           89.47%
#> TAU   | Deteriorated |  0 |   0.00% |            0.00%
#> PA    |     Improved |  9 |  22.50% |           42.86%
#> PA    |    Unchanged | 12 |  30.00% |           57.14%
#> PA    | Deteriorated |  0 |   0.00% |            0.00%
The results suggest that a much higher proportion of patients in the Placebo Amplification (PA) group (42.9%) achieved a 50% symptom reduction compared to the Treatment as Usual (TAU) group (10.5%).
The plot clearly visualizes this difference:
plot(pct_grouped)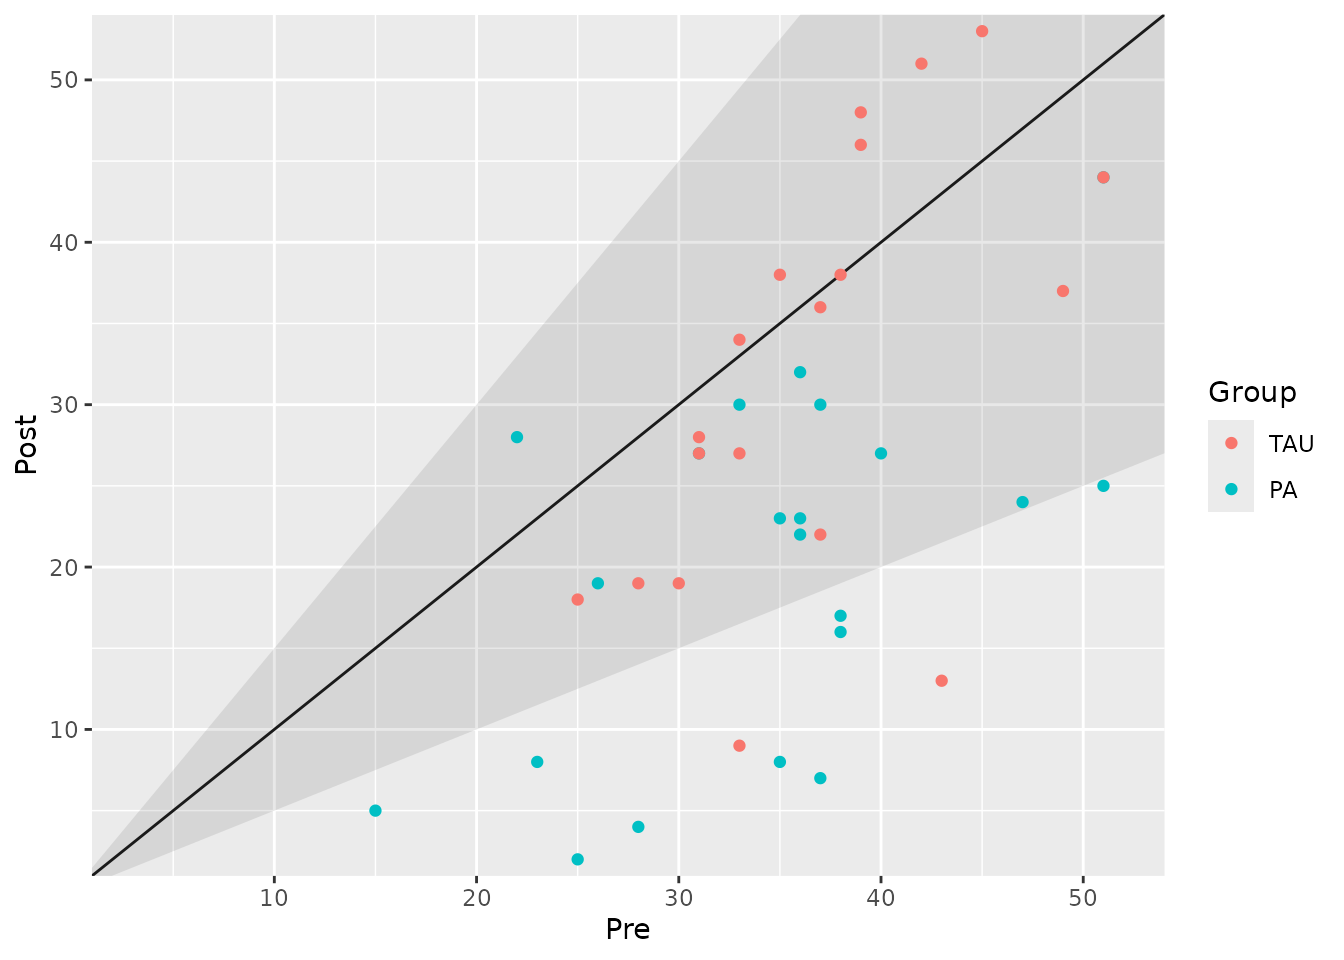
Using Different Cutoffs for Improvement and Deterioration
A useful feature of cs_percentage() is the ability to
set different cutoffs for improvement and deterioration via the
pct_deterioration argument. For instance, in some contexts,
a small worsening of symptoms (e.g., 20%) might already be considered a
significant deterioration, while a larger change (e.g., 50%) is required
for improvement.
pct_asymmetric <- claus_2020 |>
  cs_percentage(
    id = id,
    time = time,
    outcome = bdi,
    pre = 1,
    post = 4,
    pct_improvement = 0.5,
    pct_deterioration = 0.2 # A smaller threshold for worsening
  )

summary(pct_asymmetric)
#>
#> ---- Clinical Significance Results ----
#>
#> Approach:                 Percentage-based
#> Percentage Improvement:   50.00%
#> Percentage Deterioration: 20.00%
#> Better is:                Lower
#> N (original):             43
#> N (used):                 40
#> Percent used:             93.02%
#> Outcome:                  bdi
#>
#> Category     |  N | Percent
#> ---------------------------
#> Improved     | 11 |  27.50%
#> Unchanged    | 26 |  65.00%
#> Deteriorated |  3 |   7.50%