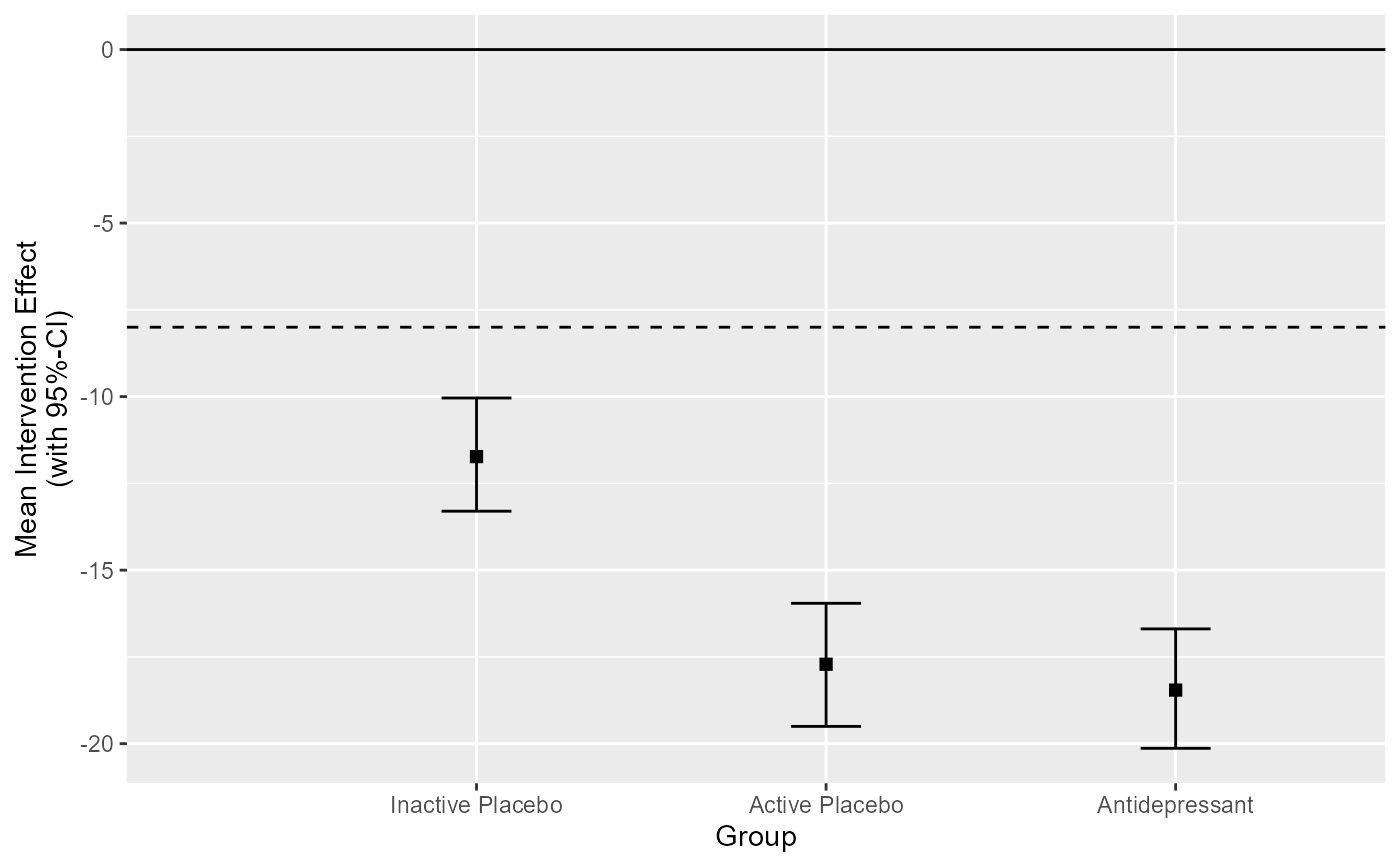
This function creates a generic group level clinical significance plot by plotting the between group change with the associated uncertainty interval around the estimated change on the y-axis.
Usage
# S3 method for class 'cs_anchor_group_between'
plot(
  x,
  x_lab = "Group",
  y_lab = "Mean Intervention Effect\n(with 95%-CI)",
  ...
)Examples
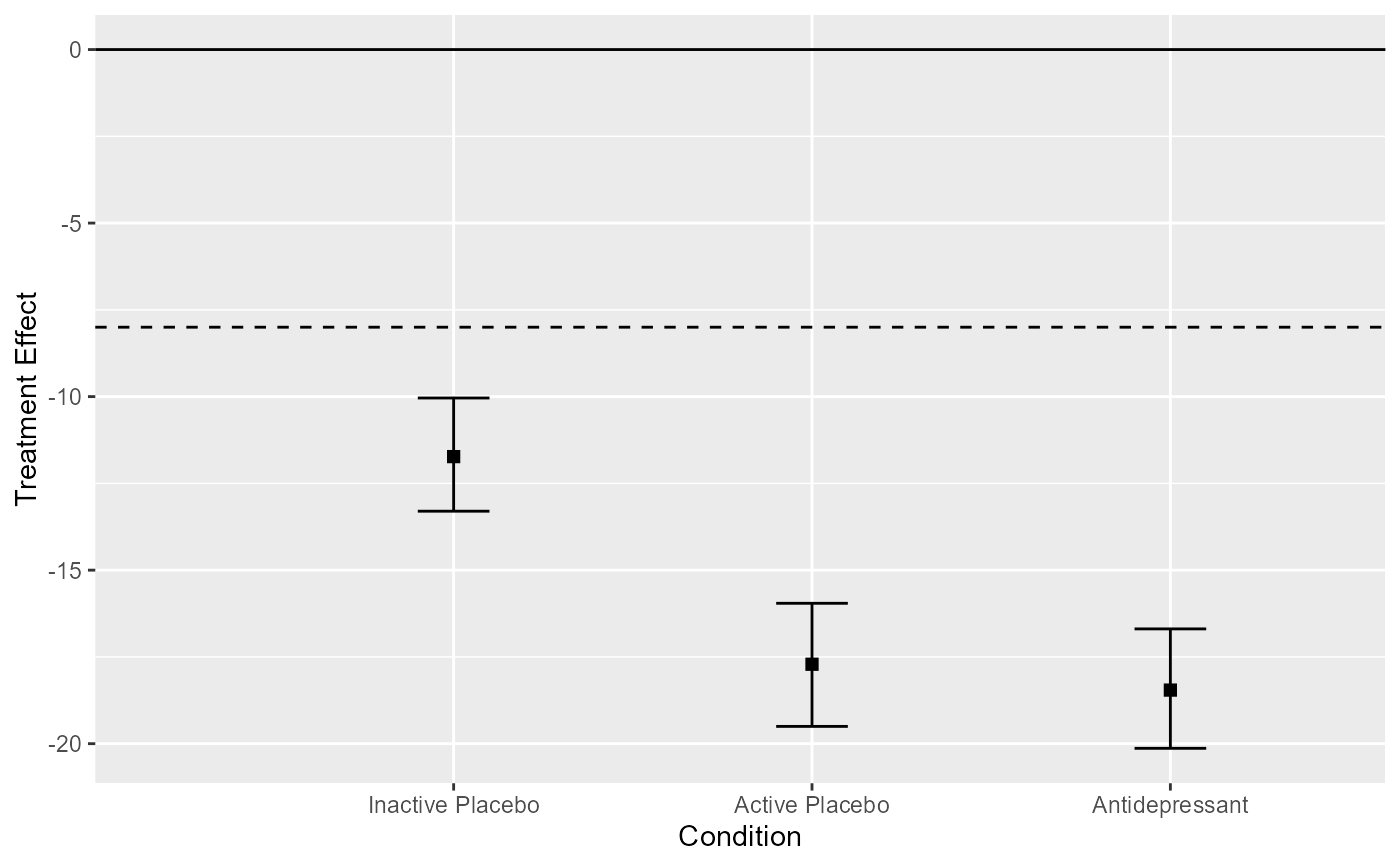
cs_results <- antidepressants |>
  cs_anchor(
    patient,
    measurement,
    mom_di,
    mid_improvement = 8,
    target = "group",
    group = condition,
    effect = "between",
    post = "After"
  )


# Plot the results "as is"
plot(cs_results)


# Change the axis labels
plot(cs_results, x_lab = "Condition", y_lab = "Treatment Effect")
# Change the axis labels
plot(cs_results, x_lab = "Condition", y_lab = "Treatment Effect")